Jmeter vs Loadrunner Which Load Testing Tool Should You Choose
How to install and use the JMeter plugins?
How to install and use the JMeter plugins?

You completed your performance testing or load tests on JMeter, now you want to monitor your test results visually on a graph or a report. JMeter has more than 70 plugins (data collector sets, performance counters, listeners, etc.) for you to review or monitor your test results, with your heavy load. If you don’t know which plugins to use, no need to worry! In this article, we tried to explain how to use JMeter Plugins Manager and listed the top 3 plugins for reporting. Therefore, you don’t have to get lost in log file jungles anymore.
JMeter Plugins Manager
The first thing to start with is JMeter Plugins Manager, which helps you to install, upgrade and uninstall your Plugins without any confusing steps.
With the help of the Plugins Manager, now you don’t have to install various plugins manually. The Plugins Manager does it itself without confusing you with installation files and etc.
How to install?
1) Download the JMeter Plugins Manager JAR file and then put it into JMeter’s lib/ext directory.
2) Start JMeter and go to “Options” menu to access the Plugins Manager.
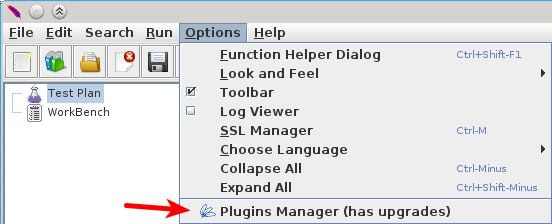
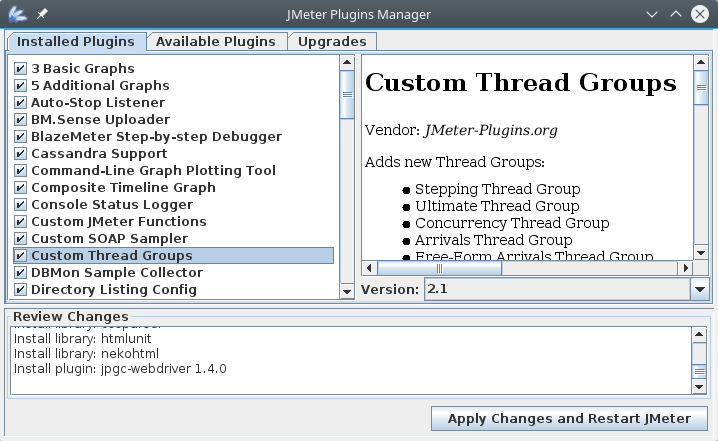
3) And here it is, JMeter Plugins Manager. From this dialogue you may install, uninstall or upgrade your Plugins only by clicking the check-boxes. The plugins which need upgrades will appear in italic mode. If you are done with your install, uninstall or upgrade, you just need to click Apply Changes and Restart JMeter.
If you want to use JMeter in command mode, you may want to check here.
You will find a crowded list with more than 70 plugins in the Plugins Manager. But don’t get confused! Below, there are top 5 plugins that you will need.
JMeter Plugins for Reporting
1. PerfMon Servers Performance Monitoring
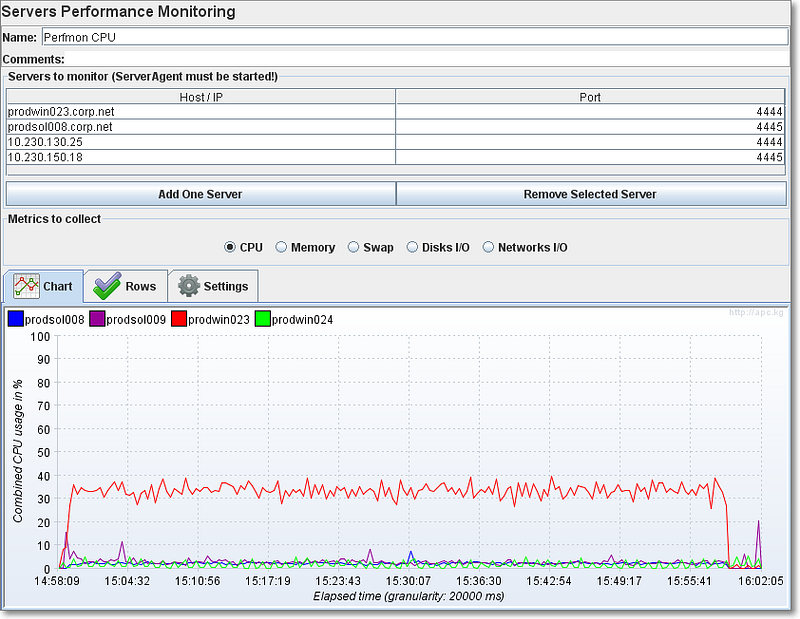
As you will understand by its name, PerfMon Servers Performance Monitoring plugin is a listener which allows you to listen to your servers health. The metrics you can monitor of your servers are, CPU, Swap, Memory, Disks I/O and Networks I/O.
For example; down you may see the CPU monitoring of 4 servers indicated with different colors on the graph.
2. 3 Basic Graphs
The “3” stands for the combination of 3 useful plugins to assess the success of your test: Response Times Over Time Listener, Active Threads Over Time Listener and Transactions per Second Listener.
Response Times Over Time Listener plots the average response time in milliseconds for each sampler in the selected test run and time interval. On this graph, you may see how many milliseconds on average have passed for the desired pages to respond (i.e. login page, landing page, etc) during your test in each sample.
Active Threads Over Time Listener shows the number of active threads in each of the test groups, determined in your test plan.This means that you are able to see the active users for your test run via this plugin.
Transactions per Second Listener plots the count of the finished transactions in each second. With the help of this graph you may see the test result of how many logins, logouts or searches are finished in your website in each second.
3. Command Line Tool
You want to generate graphs but you prefer to set the parameters via command line. Luckily, the Command Line Tool comes with JMeter Plugins Manager by default.
If you want to see the list of commands and parameters, you may want to check here.
This plugin produces launcher bat/sh files in JMeter’s bin directory.
for Windows: JMeterPluginsCMD.bat
for MacOS and Linux: JMeterPluginsCMD.sh
Ta-da! All of the reasons behind your performance issues are depicted on the graphs. You are now ready to run your load tests on JMeter and analyze your test results via the useful JMeter Plugins. To get weekly updates on JMeter, you can sign up for our newsletter.